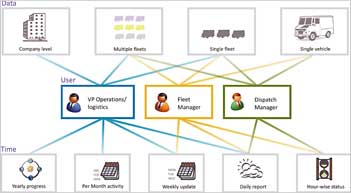
Commercial fleet carry billions of pounds of cargo across the US each day. Fleet management is operationally intensive and requires good logistics planning and execution. Fleet owners use wireless technology to monitor the trucks on their routes. There are a number of operational hurdles the driver may face. The data collected from the vehicles are processed and presented as reports viewable via a website. Operations managers would like to be able to optimise operational parameters (e.g., fuel costs) across the entire fleet over a given time period.
My project was an attempt to understand the various aspects of the problem, come up with alternative ways of representing the information, test these representations for effectiveness and usability, and then develop a prototype using actual data.
As a visualiser, my role in the project spanned across the entire design process right from understanding the data from experts, comprehending it and creating the final visualisation demo. I realised early that fuel optimisation is of primary importance to most companies. My visualisation helps operation managers understand logistics and data better in order to optimise fuel costs and maximise profits.
This project has been an eye opener in many ways, from having to understand a huge quantum of never before seen data to the amazement of how interaction can bring it all together in a small screen and in a comprehensible manner. |